BLC1 - Breakthrough Listen's First "Signal of Interest": Verification Flowchart
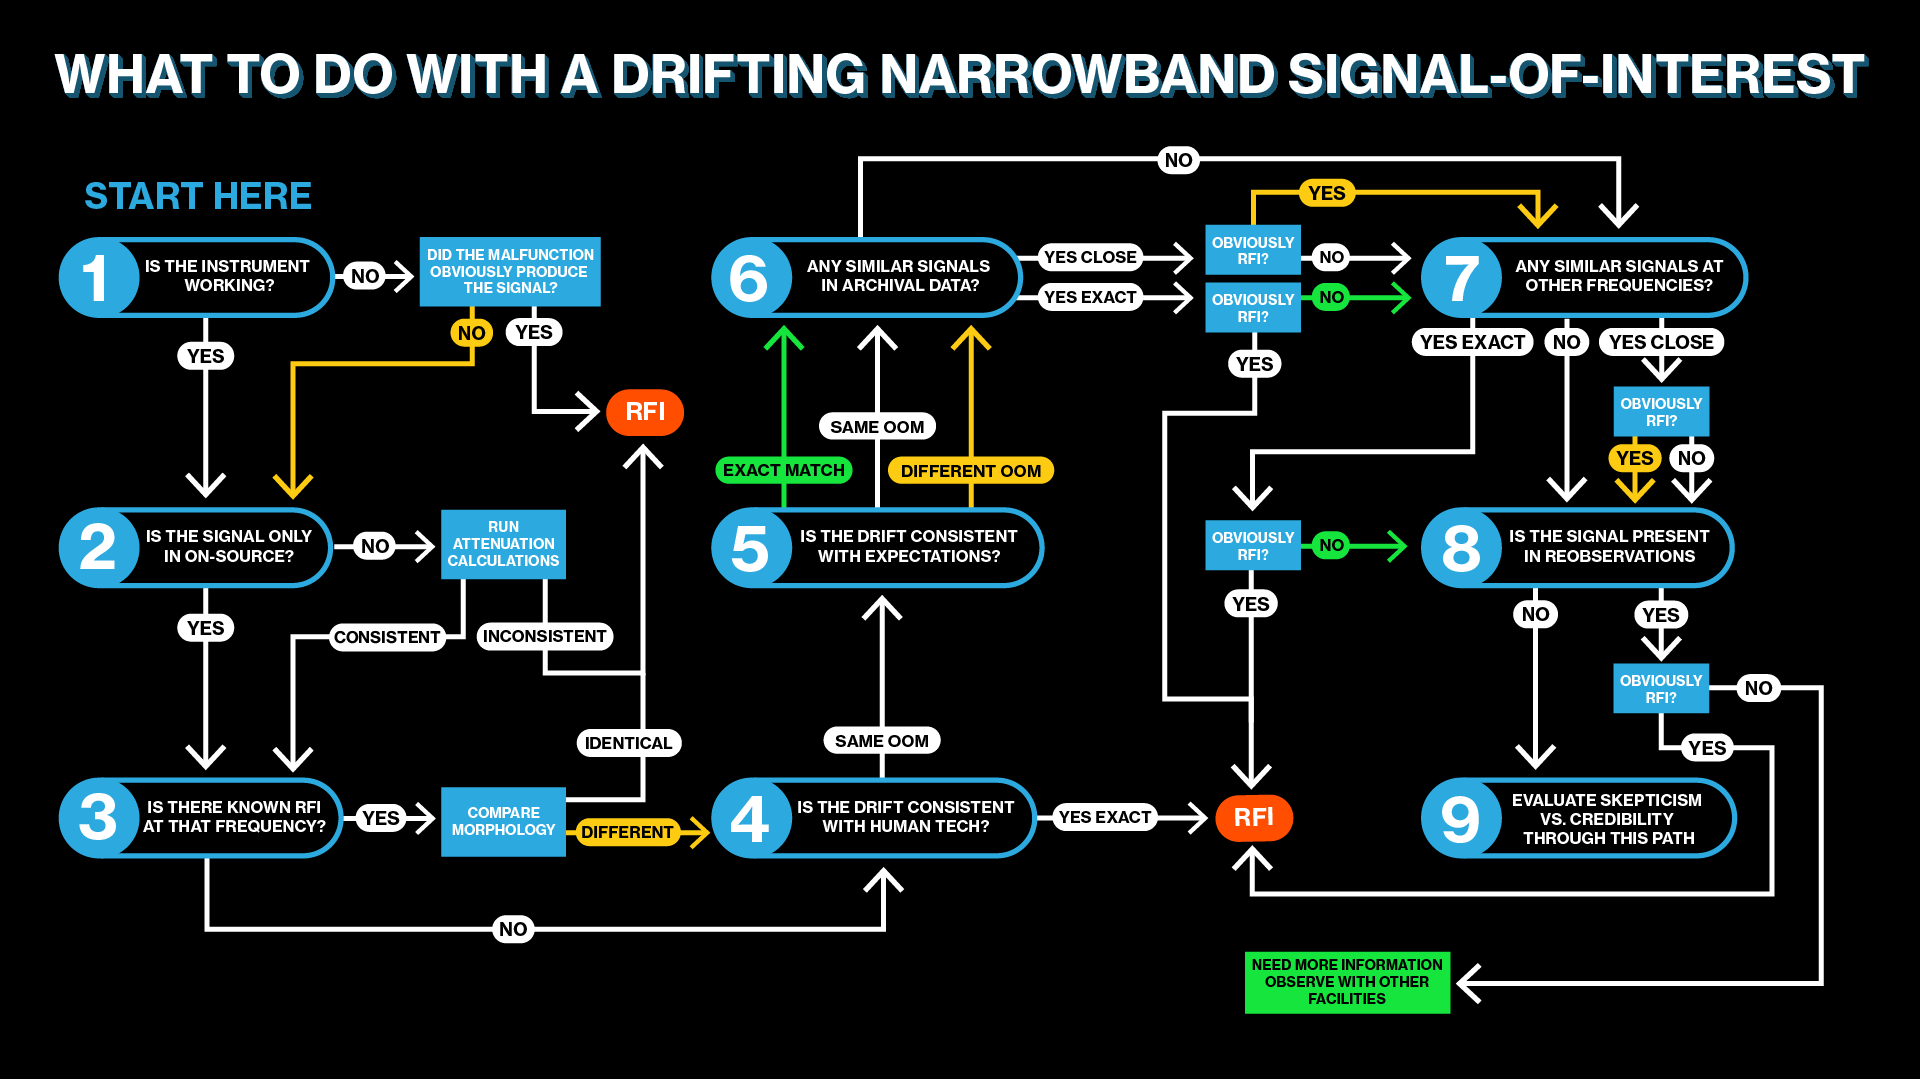
This page provides a technical overview of the steps taken to vet signals such as blc1, in order to distinguish between local interference and a bona fide technosignature candidate. This vetting framework is illustrated in the following flowchart. If you discover a signal-of-interest, you should start at Step 1 on the left hand side of the flowchart. As you progress through the flowchart, running experiments and analysis along the way, your journey will end (and the signal be revealed as radio frequency interference, or RFI) if you hit a red "RFI" box. Of course, sometimes it's not that simple. If you traverse a yellow path in the flowchart, your signal has a characteristic that is suspiciously similar to what we might expect from Earth-based RFI, and you should be additionally skeptical. If you traverse a green path in the flowchart, your signal has a characteristic that we associate with an extraterrestrial origin, and you should weight the possibility that your signal-of-interest has an extraterrestrial origin more heavily.

The first thing that you should do if you see a "weird" signal is to make sure your system is working the way that you expect. Malfunctions in the system can be unrelated to the signal: for example, if you lost data recording above 3 GHz but your signal appeared at 2 GHz. However, an overheating signal generator or loose cable can cause "weird" signals to appear in the data, so those sorts of malfunctions should be deeply investigated. For example, the now-retracted claim of faster-than-light neutrinos in 2011 was found to have been based on a few unexpected instrumental errors.

Whenever we search for astronomical radio signals, we have to have a way to distinguish whether a signal is coming from the near-field (e.g., a nearby cell tower) or the far-field (e.g., a beacon from a distant star). But, for a single-dish radio telescope, the two scenarios may look the same for a single observation of our target. To combat this, you must observe the main target (the "on-source") and then observe something somewhere else on the sky (the "off-source"). If you see the same signal in both observations, the signal is likely Radio Frequency Interference (RFI) coming from nearby on the Earth's surface. But there's a wrinkle! If a true interstellar signal is bright enough, it might leak into our telescope even when you aren't pointed directly at it. To determine how bright you expect a signal to be in the on-source vs. the off-source, you need to run calculations on how much the source should be "attenuated" (or dimmed).

RFI can be hard to characterize. Luckily for SETI scientists, it's not an entirely unknowable phenomenon. Many radio technologies operate in particular parts of the spectrum, dictated by national governments or technological constraints. For example, you may have a WiFi router that uses both 2.4 GHz and 5 GHz. For that reason, we would be pretty skeptical if we saw a signal at exactly 2.4 GHz. However, a signal's "fingerprint" consists of more than just its frequency: other characteristics, such as its morphology (shape) or brightness over time can also help identify it. So if there's known RFI at that frequency but the signal looks completely different, they might just be coincidentally located at the same place in the spectrum.

Another common signal characteristic for narrowband signals is the signal's "drift rate" a.k.a. change in frequency over time. This drifting effect is often caused by the transmitter accelerating relative to the telescope. For technology that moves very predictably, like satellites in known orbits, you can use the drift rate to identify which moving object is producing the signal by matching the orbit. Unfortunately, there are many transmitters that don't have such predictable paths or schedules - say, a cyclist riding by with a phone in their pocket. If you can't identify the exact human-made transmitter that produced the signal by looking at the drift rate, you don't gain too much information. All you can say in that case is that human-technology can produce signals with drift rates of the same "order of magnitude" (OOM) i.e., within a factor of 10 of what you observed.

As mentioned in the previous step, drift rates are caused by acceleration. Planets, and the transmitters that could reside on or orbit them, accelerate as they rotate and orbit their host stars. For some stars in the sky, planet-finding telescopes like TESS have determined that they have planets, and we know the sizes and orbits of these planets quite well. This gives us expectations for what sorts of drift rates their associated transmitters could produce. If, for example, a planet had a 12-hour rotation period (a 12-hour day) and you saw a signal appearing and disappearing every 6 hours, as if a transmitter was rotating into view and then away again, that would be a pretty fascinating match. On the other hand, if the drift rate of our signal is so high that nothing in that exoplanet system could produce it, that would not be promising. Unfortunately, given the large errors on exoplanet parameters and current unmeasurability of exoplanet rotation periods, the most you can say is likely "it's the same OOM, so it could be from a planet in the system".

Another important branch of investigation for a signal-of-interest is to determine whether you ever saw the signal again, either towards the same target or towards other targets. This is why it's important to keep archival data available, even if you've finished using it for another project: the Breakthrough Listen project, in part, does this through our Open Data Archive. When you search for archival re-appearances of the signal, three things can happen:
Option 1) You see the signal again in another observation
Option 2) You don't see the signal again in another observation
Option 3) You see a signal that has some characteristics in common with the signal-of-interest, but also some differences
In Option 1), if the archival signal is from a different target than your original signal-of-interest, your signal-of-interest is almost certainly RFI. If it is from the same target as the original, you have to evaluate whether the archival signal holds any additional clues to its origin (i.e. if it appears in an off-source from Step 2 and is itself RFI). If you see a perfect reappearance that looks exactly like your original signal and is not obviously RFI, congratulations: you've found a repeat of the signal! This has never happened in any SETI search to date.
In Option 2), you don't gain any additional information.
Option 3) is the most complicated - just like in Step 3, a similar signal isn't necessarily the same signal. How close is "close enough" to be considered a match? These are questions that a SETI researcher must contend with in this stage of the analysis, often through employing statistical methodology.

In human radio technology, we often send information on multiple frequency channels at the same time for improved bitrate and/or redundancy. Similarly, there are common malfunctions (ex. the production of aliases) that can cause signals to appear copied or mirrored across the bandwidth of a radio receiver. Therefore, it's a good idea to look at the rest of your frequency range for copies or lookalikes of your signal-of-interest. If you find them, it's not necessarily "game over" for an alien explanation: if we use multiple channels in our technology, it's possible that other intelligences would do the same thing! But if you do find them, you have to again evaluate whether those lookalikes are similar to, or exactly the same as our signal-of-interest, just like in the previous step.

As in any scientific endeavour, reobservation of a signal-of-interest is key in being able to validate it as a real phenomenon. As soon as a signal is discovered, you want to try to get as much data as possible on it. At first you'll want to use the same telescope, to see if you can replicate the observation. If you don't redetect it with the same telescope, you move to Step 9.

If you do not redetect the signal-of-interest, then you have to evaluate your confidence in the rest of the analysis you've already performed, much of which will come down to whether you traversed any yellow paths in the flowchart (indicating that you should be skeptical of the signal having an extraterrestrial origin) or green paths in the flowchart (indicating that you should be cautiously convinced, as the characteristics are expected of a signal with an extraterrestrial origin). In the end, even for an otherwise-perfect match to what we would expect from an extraterrestrial intelligence, the lack of a redetection should add a large amount of skepticism to the claim that you have detected a real signal.
Remember how I said that you move to Step 9 if you don't have a redetection with the same telescope? Well if the signal appears again, you'll want to bring in other telescopes from around the world, especially those of different designs, to see if the signal-of-interest is just local RFI that somehow got through the rest of the flowchart. No signal-of-interest has ever progressed to the final green box, where it has been redetected with the same instrument after passing all of the other verification checks. Until then, we keep searching!
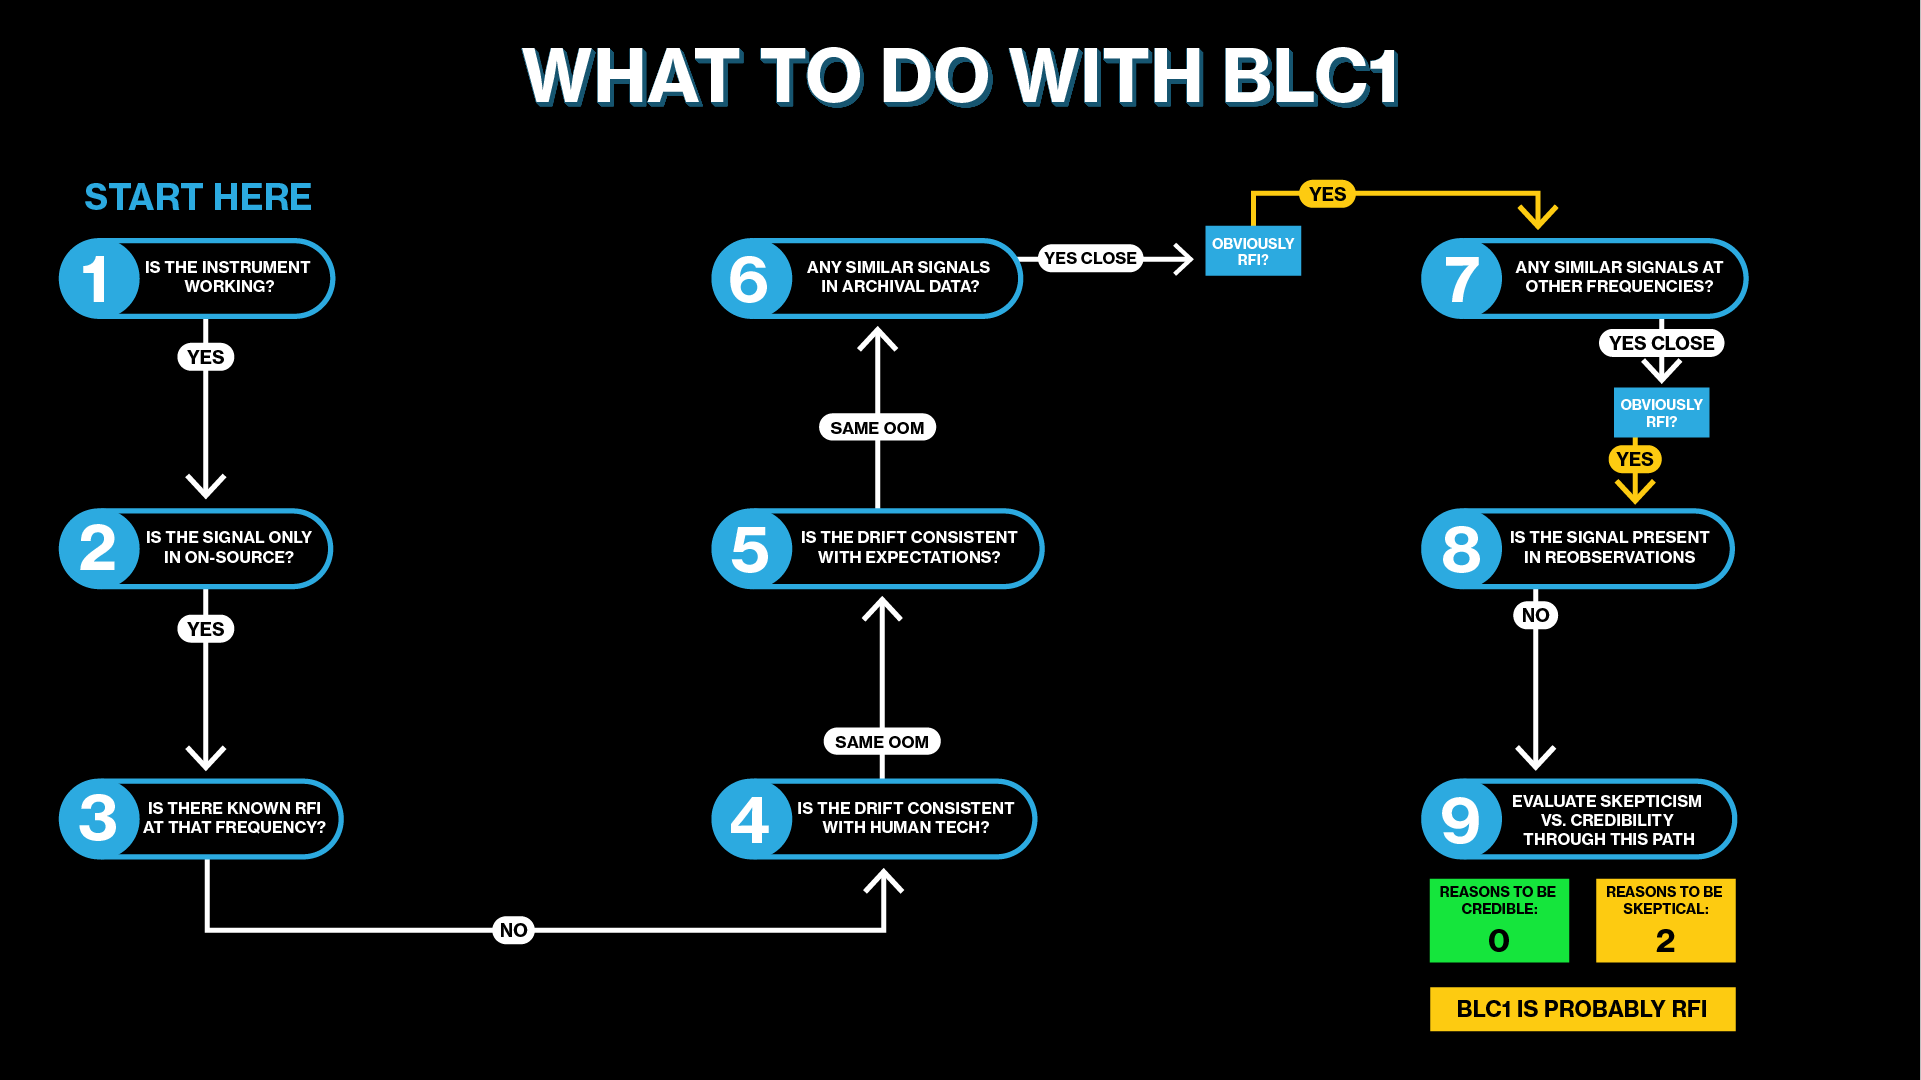
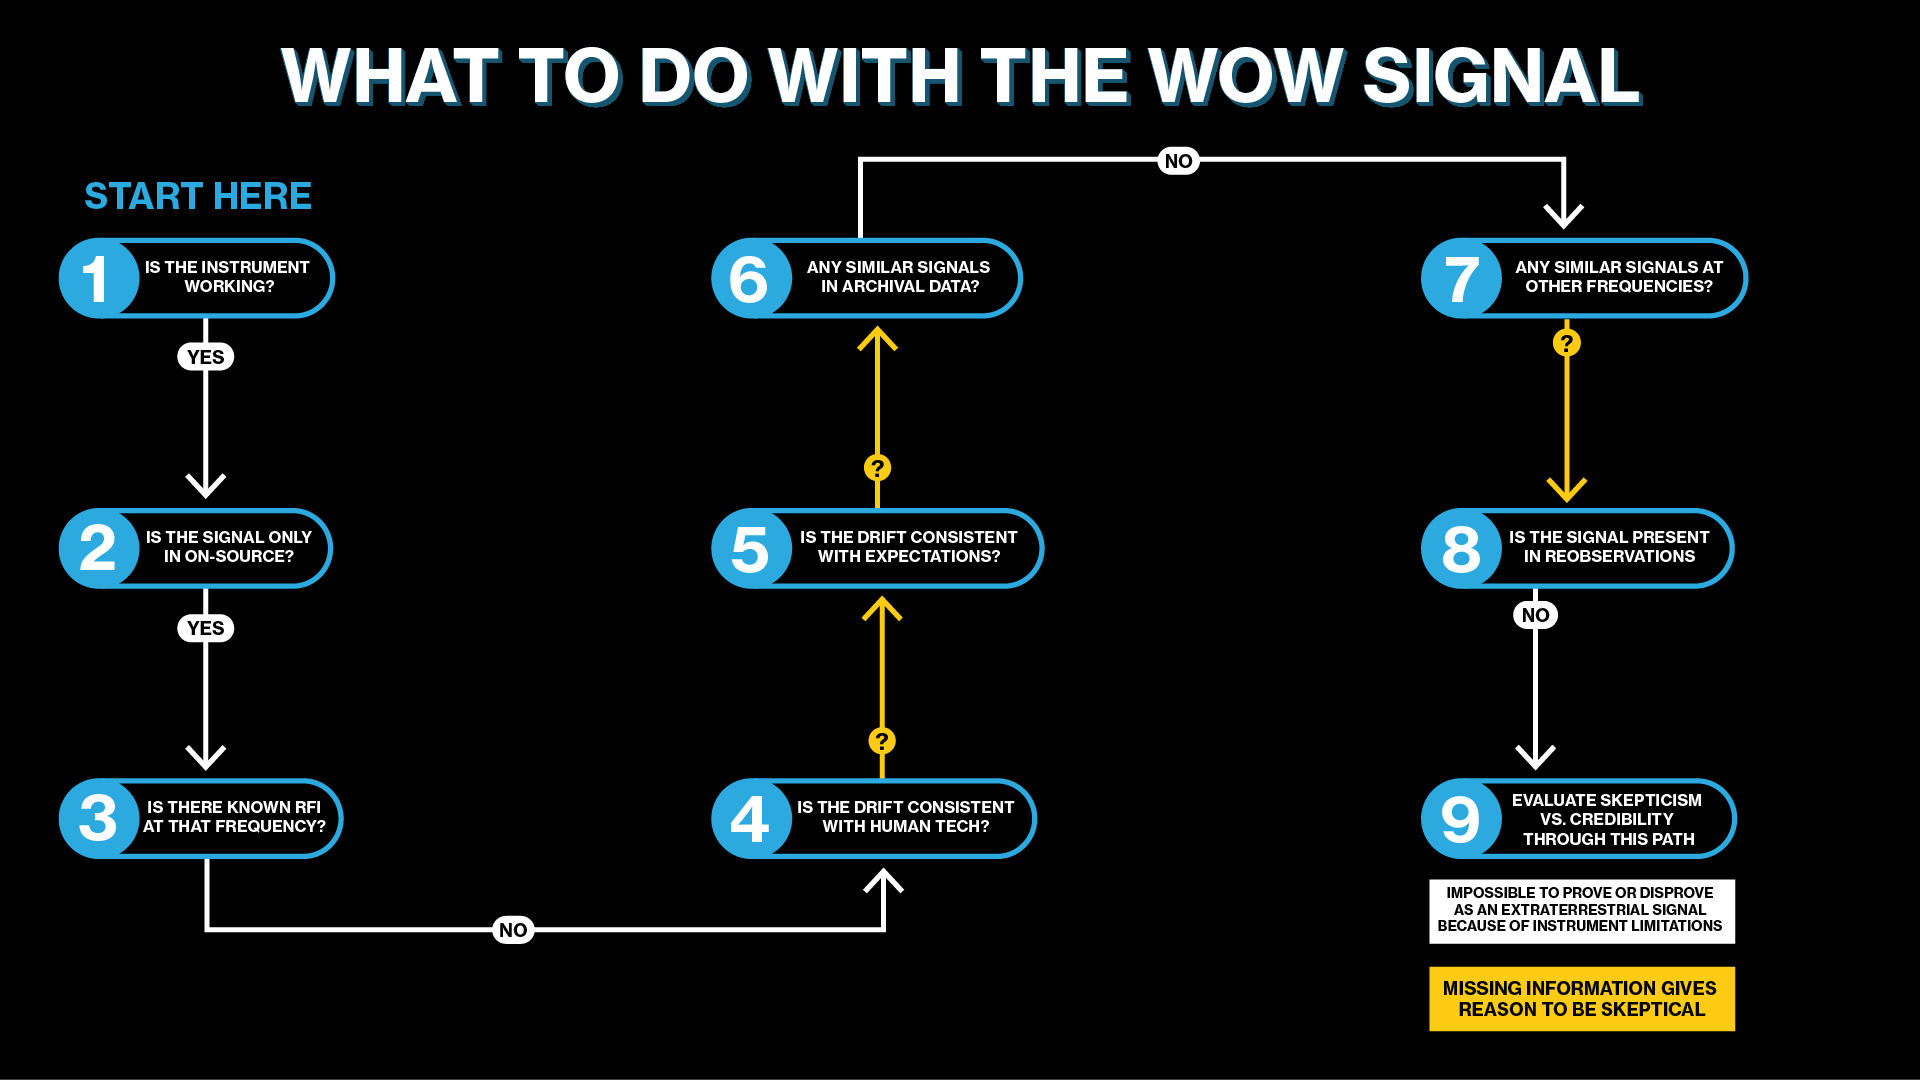
Now that we've been through each step in depth, we can look at how the flowchart applies to two prior signals-of-interest: blc1 and the Wow! Signal.

Background Art by Danielle Futselaar