Animation
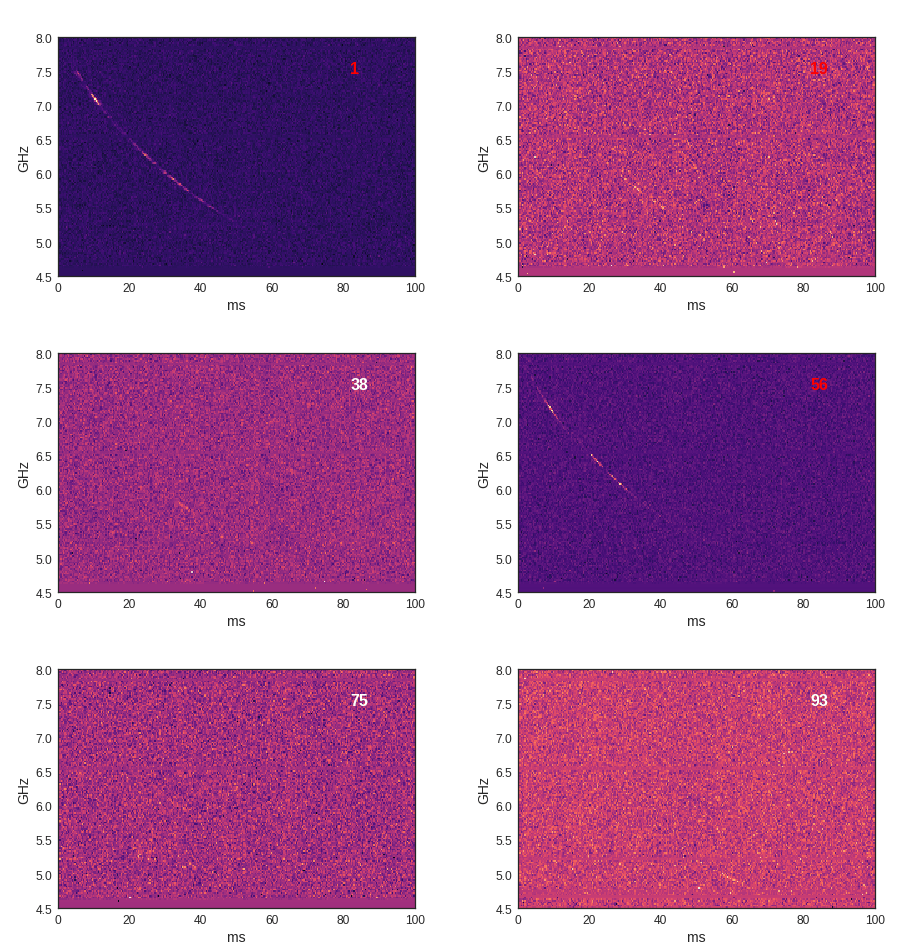
This animation shows 93 detected signals from FRB121102. Among them 21 have previously been reported (denoted by red numbers), and 72 are new (white numbers). Each signal is shown as a spectrogram - the colors indicate the intensity of the signal as a function of frequency from 4.5 to 8.0 GHz (vertical axis) and time (horizontal axis, showing 100 milliseconds around the time of detection of each burst). The pulses exhibit a wide range of modulations and brightness.

