As we’ve already discussed, one strategy that we use with the Breakthrough Listen telescopes is to look for signals that are narrow in frequency, time, or both. We can’t be sure that extraterrestrial civilisations will choose to transmit narrow-band signals, or even that they will use radio or laser communications at all, but if they are deliberately trying to attract attention, a narrow-band radio or laser signal is a great way to do so. Both are capable of traversing interstellar and even intergalactic distances, and tend to stand out against the background of natural signals primarily because they span just a narrow range of frequencies.
Our instruments at both APF (in the optical) and GBT (in the radio) act as spectrometers, splitting up the incoming electromagnetic waves into measurements of power as a function of frequency. Natural processes can give rise to both continuum emission (processes that emit over a wide range of frequencies) as well as spectral lines (emission at a narrow range of frequencies), but nature finds it extremely hard to make very narrow-band signals. Thinking back to our discussion of radio stations, as we tune through the dial, everything we see that has a lot of power concentrated in a narrow band is from an artificial transmitter.
One part of our analysis pipeline focuses on sifting through the data and looking for narrow-band signals. For GBT, the main contaminants are artificial transmissions from human activities, which we refer to as RFI (radio frequency interference). To try to determine whether a narrow-band signal is coming from the sky rather than a local interferer, we see if the signal disappears when we point away from the star we are interested in, and returns when we look back at the star. We can also look at how the frequency of the signal changes with time. The software performs this analysis automatically, but we can also visualize this as a waterfall plot, just as we did when we looked at software defined radio.
Here we show a waterfall plot made from data at GBT. Time (in seconds) runs on the vertical axis, frequency (in GHz) on the horizontal axis. Can you spot the artificial signal?
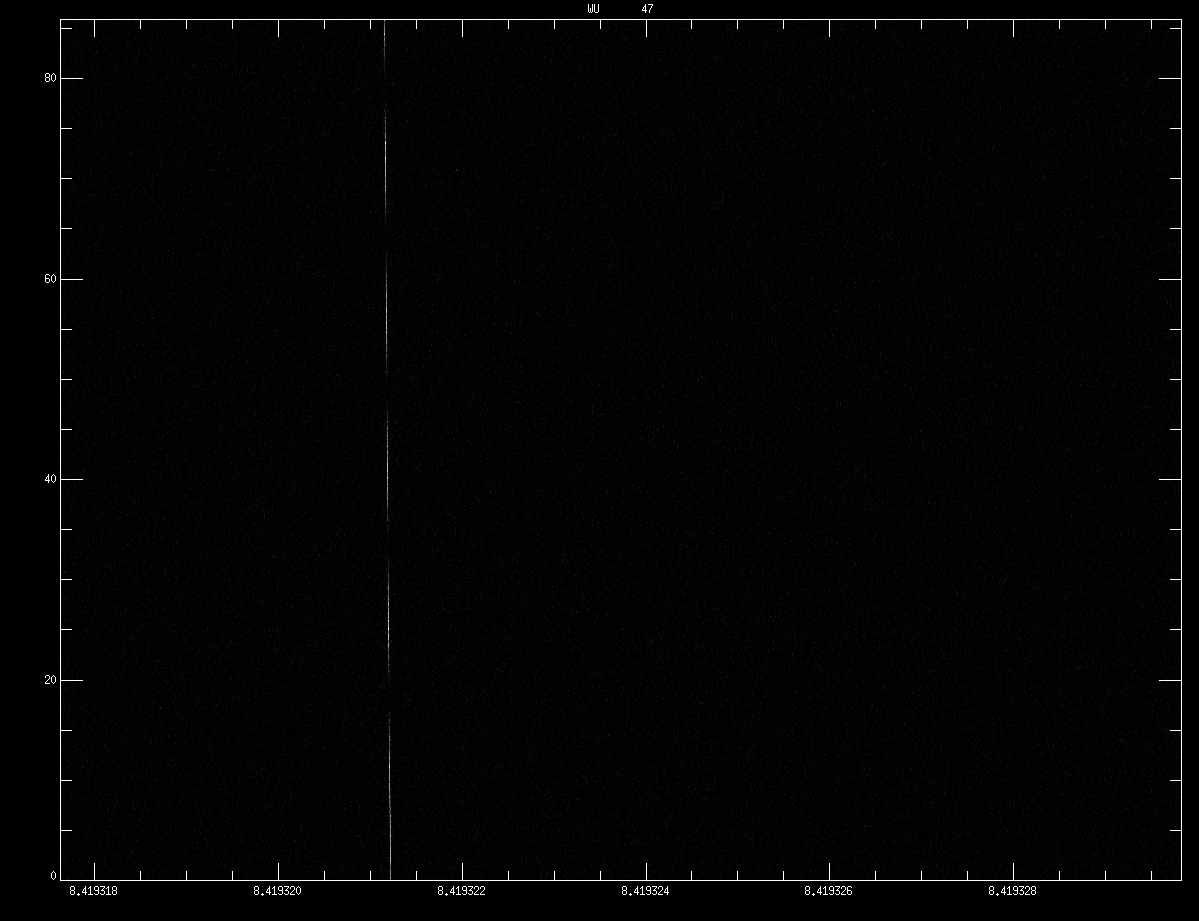
The white line running almost vertically in this plot is the Voyager I spacecraft, detected in December 2015 by our instruments at GBT. Voyager I is currently over 20 billion kilometers from Earth - in fact, it’s the most distant human-made object. It carries a 20 Watt radio transmitter (about the same power as a refrigerator light) but even at these huge distances, our instruments can pick it up loud and clear. Voyager provides a good test for the equipment that we’re using to try to detect similar signals (broadcasting at much higher power) from civilizations around other stars.
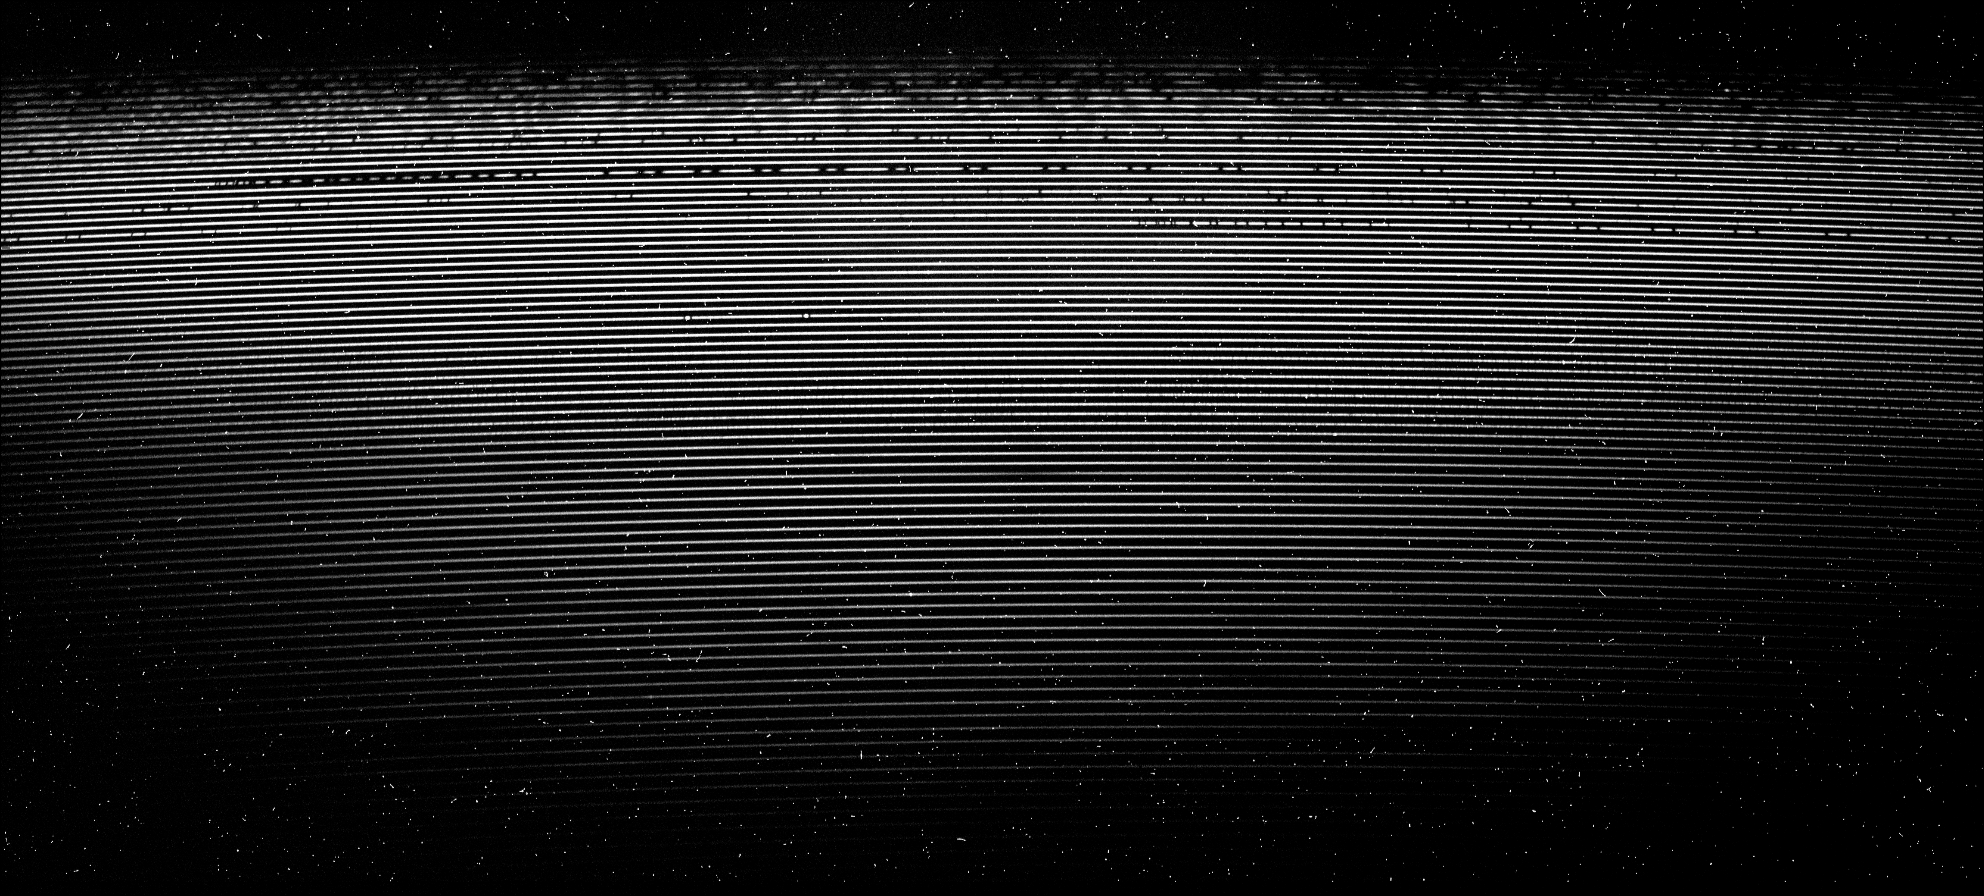
Just like GBT, the Levy Spectrometer at APF splits up incoming electromagnetic waves into their constituent frequencies. As we point the instrument at nearby stars, we see continuum (broad-band) emission from the star, along with natural spectral lines, both from the star, and from Earth’s atmosphere. These lines can be in emission (adding to the continuum light) or absorption (subtracting from it), but naturally occurring lines are always broader than we would expect a narrow-band laser pulse to be. Whereas for our GBT radio observations, the main contaminating signal is RFI from human activities, for APF, the main contaminant is bright pixels in the detector due to hits from cosmic rays. These are high energy particles that hit the detector directly and deposit their energy, creating sharp-edged features that under certain circumstances could mimic the laser pulses we are trying to detect.
Here we show a spectrum from APF. The star targeted here is known as KIC 8462852, or “Tabby’s Star”. This object has recently been the subject of much media attention due to the strange behavior of its lightcurve (how bright it appears as a function of time). Although the most likely explanation for this behavior is a natural one, some have speculated that megastructures constructed by alien civilizations around the star would produce such a signature. Breakthrough Listen is monitoring Tabby’s Star in addition to a wide range of other targets.
The APF spectrograph takes the light falling on a narrow slit (which we align with the position of the star on the sky) and spreads it out into its constituent colors. Imagine this spectrum as a tickertape with wavelength (or color) running along the long axis, and position on the sky running along the short axis. Then chop the tickertape into smaller chunks to enable it to fit on the detector (the white stripes running from top to bottom), and what results looks something like this:
Each of these chunks (referred to as a spectral order) is a 2-dimensional spectrum (frequency versus position) but we can extract a 1-dimensional slice along the wavelength axis to see how bright the object appears as a function of frequency. As an example, here is the region of the above spectrum near the hydrogen-alpha absorption line in the spectrum of the star.
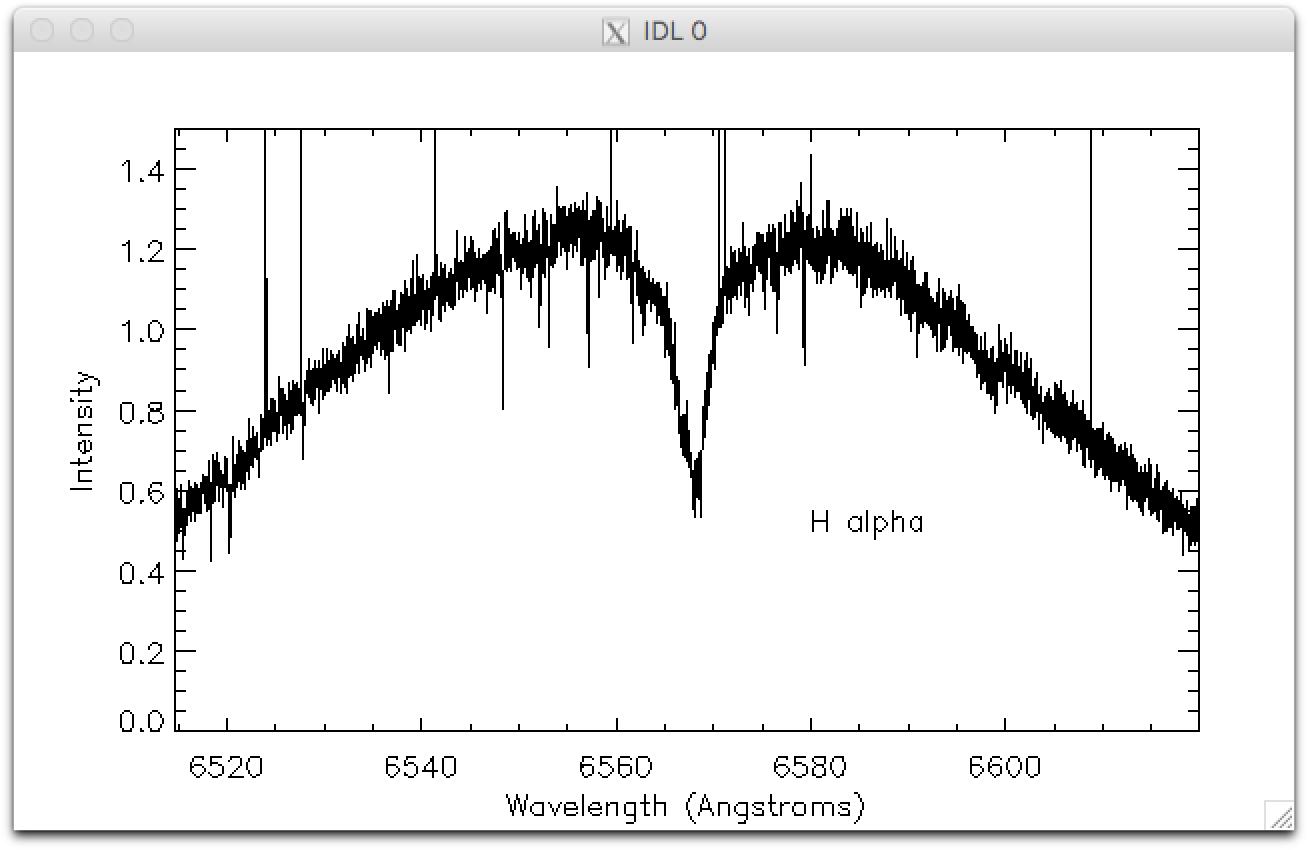
The dip seen in the middle is due to hydrogen in the star’s atmosphere, as are several other fainter and narrower absorption lines. But what about the forest of spikes we see here? Is this a sign of extraterrestrial intelligence? The answer is “probably not” - they all have signatures that we would expect from cosmic rays or other defects. We are in the process of developing software to automatically remove the cosmic ray hits from spectra of our objects. Remaining sharp spikes could potentially be due to the laser pulses we are searching for, but will require a lot more additional work to confirm.