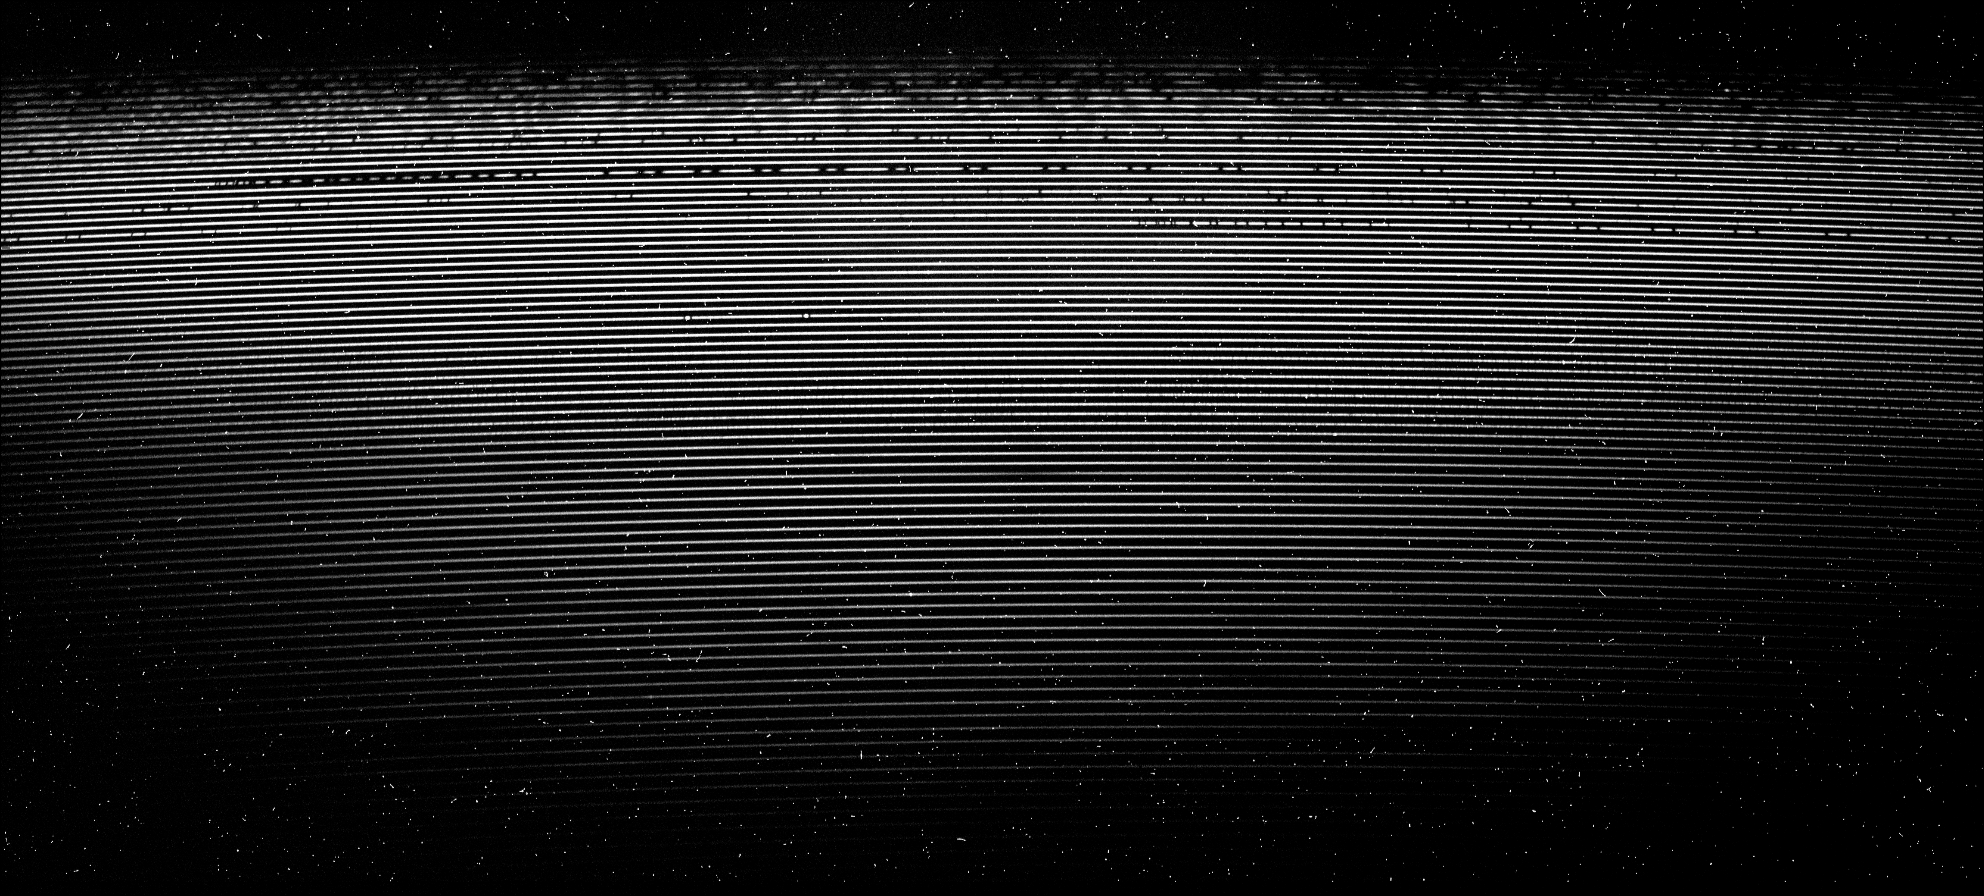
As well as participating in the analysis of Breakthrough Listen data through SETI@home, we are inviting those who are interested to help us develop software and algorithms to process our data. This requires a certain amount of technical background, but we’d like to help you get started. We’re releasing Breakthrough Listen data, from both APF and GBT, to the public. Particularly for the GBT, the file sizes are large, and the data formats are technically complex. If you have experience with big data, machine learning, radio communications, or signal processing, you may wish to start off by looking at data from GBT. Otherwise, you might find the APF data to be more accessible.
Much astronomical data analysis now takes place with Python. If you don’t have programming experience, you should start by learning basic Python, which is used in a huge variety of modern programming applications and careers in addition to astronomy. A good place to start is Getting Started at Python.org or the O’Reilly “Learning Python” book but there are many other resources available both on- and off-line. Even if you do have programming experience in other languages, you’ll likely find Python to be useful if you want to analyze Breakthrough Listen data. Some computers come with Python pre-installed, but we recommend that you install a Python package such as Anaconda which comes with many extra tools that you will find useful.
Once you are comfortable writing Python code, including the basics of numPy and Matplotlib you should spend some time exploring AstroPy, a community Python library for astronomy.
Our APF data are stored in FITS format, the main standard for astronomy data. FITS can be used to store images (in a similar way to more well-known formats like JPEG or GIF), spectra, voltage streams, or other forms of astronomy data. Check out an introduction to analyzing FITS files with AstroPy
The Breakthrough Listen team consists of scientists and engineers with many years of experience designing SETI experiments, building hardware, and writing code. Many of our own team members got their start by cultivating their own interests in science and engineering, experimenting with computers and electronics, and reading everything that they could get their hands on. We are committed to engaging and encouraging the next generation of SETI scientists; in the coming months, we’ll be developing more content and curriculum for high school and undergraduate students, as well as additional opportunities for you to get involved. We won’t pretend it’s easy though, and until you have read all of the material we dis cuss above (and understood the majority of it!) you may find wading deeper into our data to be somewhat frustrating. But if you’re starting to feel confident in the techniques we discussed above, you might be ready to take a look at some example data.
We are storing some of our code, documentation, and related materials in a public github repository at https://github.com/UCBerkeleySETI/breakthrough. We'll be adding to this repository over time, as we continue to build up a comprehensive curriculum, but for now you may be interested in checking out this repository (see https://help.github.com/articles/set-up-git/ for instructions) and working through the examples below.
The link below will take you to the APF spectrum of Tabby’s Star from the previous page, but this time in FITS format; you'll also get this file if you check out our github repository. If you feel you’re sufficiently familiar with AstroPy, try downloading this file and displaying it using Matplotlib. Can you reproduce the image of the APF spectrum shown on the previous page?

Once you’ve managed to display the 2D spectrum, here are some tasks you might try (see documentation in the github repository for further details):
- Extract a 1D spectrum from the 2D fits file, and reproduce the 1D spectrum plot on the previous page
- Perform a Gaussian fit to the H-alpha absorption line - what central wavelength do you find?
- How many cosmic rays are in this image? Can you write a routine that identifies and removes them without removing real data?
Share your results with us on Twitter, using hashtag #BreakthroughAPFData
To reproduce the waterfall plot of the Voyager spacecraft using GBT data is more challenging. File sizes are much larger, and the data format is more complex. Check out the documentation in the github repository for links to access the sample data and analysis tools.
Here are some experiments to try:
- Reproduce the waterfall plot
- Determine the observed frequency (in GHz) of the coherent downlink carrier (main signal in the center of the waterfall plot), and the offset (in kHz) of the modulated subcarrier with the telemetry data
- Determine the drift rate of the above signals with time
- Calculate the Doppler velocity of Voyager with respect to Earth at the time of the observations
Share your results with us on Twitter, using hashtag #BreakthroughGBTData
If you’ve successfully completed the tasks above, you may be interested in wading deeper into our data and our code.
Much of the legacy SETI@home code is written in C, and if you have experience in C programming, you may wish to start by exploring our code base: https://setiathome.berkeley.edu/sah_porting.php
We’re also developing more code specifically for Breakthrough Listen that we’ll be making available in our github repository soon. This code will also be open source.
Here are technical descriptions of some of our hardware: https://casper.berkeley.edu/wiki/Projects
If you’ve worked on analysis of the above two example data files and would like to access our archive of APF and GBT data, you can do so here